
Operational excellence is not a project with an end date. It is a moving target that keeps shifting as a plant improves, since the bar for good performance rises right along with it. What keeps a team aimed at that target, shift after shift, is data, specifically the kind that shows what is actually happening on the line right now rather than what happened last week. Production line performance monitoring is the piece that connects daily floor activity to that larger goal, giving teams the visibility to close gaps as they open instead of finding them in a monthly review.
It is also worth being clear about what operational excellence is not. It is not a single project, a certification, or a milestone a plant checks off and moves past. Plants that treat it that way tend to see performance climb during an initiative and then slide back once attention shifts to the next priority. Real operational excellence holds because the visibility behind it never turns off.
This article looks at what operational excellence actually requires, what production line performance monitoring measures, and how that data translates into the kind of continuous improvement operational excellence depends on.
What Operational Excellence Actually Requires
IBM describes operational excellence as a way for organizations to build a roadmap toward continuous improvement in a complex business environment, to create a lasting competitive advantage (source: IBM). On a production floor, that translates into three things happening at once: consistent output, consistent quality, and a working system for improving both over time rather than simply maintaining them.
The catch is that all three require visibility across every line and every shift, not just the ones a plant manager happens to walk most often. A line that looks fine during a Tuesday morning walkthrough can behave very differently on a Friday night shift with a different crew and a different product mix. Without continuous data, that gap simply goes unseen.
This is why so many operational excellence initiatives stall after an encouraging start. A kickoff event, a training session, and a round of process mapping can genuinely improve a line for a few weeks. What determines whether that improvement lasts is whether anyone is still watching the line closely a year later, long after the initiative’s momentum has faded from the calendar.
What Production Line Performance Monitoring Covers
Production line performance monitoring tracks the core signals that determine whether a line is actually running the way it is supposed to: cycle time, throughput, downtime, and variability between stations. The distinction that matters here is monitoring the line as a system, not just a single machine or station in isolation. A station running perfectly on its own does not mean much if it is starved by a slow upstream process or blocked by a bottleneck two stations down.
Our Production Management solution gives team leads exactly this kind of real-time pulse on every line, with alerts when cycle times drift, throughput drops, or a specific station falls behind, so the issue gets addressed the moment it appears rather than surfacing in an end-of-shift report.
This system-level view also helps teams tell the difference between a local problem and a structural one. A single station running slow might just need a quick adjustment. A pattern where the same three stations consistently fall behind, shift after shift, regardless of who is working them, usually points to a line balance issue that no amount of individual coaching will fix. Continuous monitoring makes that distinction visible instead of leaving it buried in anecdotes.
From Data to Decisions: Closing the Loop on the Floor
Real-time alerts change how quickly a team can move from noticing a problem to fixing it. Instead of discovering a slowdown at the next shift review, a team lead sees it happening and can react within minutes, while the cause is still fresh and the people involved are still on the floor. That shortens the entire loop, from spotting an issue to root-causing it, to confirming that whatever fix got put in place actually held.
That confirmation step matters more than it might seem. Plenty of process improvements look successful for a few days and then quietly slip back to the old pattern once attention moves elsewhere. Continuous data catches that regression immediately, instead of letting it go unnoticed until the next scheduled review.
This is also where operational excellence tends to separate itself from a series of one-off wins. A single well-run improvement project can boost a line’s performance for a quarter. A closed feedback loop, where every change is measured, validated, and monitored for regression as a matter of course, is what keeps that gain in place a year later and builds toward the next one. Our Continuous Improvement solution is built around exactly this kind of ongoing visibility, replacing periodic manual time studies with always-on data so industrial engineering teams can spend their time improving processes instead of collecting the data needed to evaluate them.
Connecting Performance Monitoring to Quality Outcomes
Performance and quality problems are more connected than they are usually treated. A station running slower than standard is often the same station generating rework, whether that is because an operator is compensating for a process issue or because an upstream defect is forcing extra inspection. Being able to trace a quality issue back to the exact cycle and station where it happened, rather than reconstructing it after the fact from a paper trail, cuts investigation time significantly. Our Quality solution focuses on catching process deviations at the station before they become escapes, with video context that replaces guesswork with a clear record of what actually happened.
This connection also changes how a team prioritizes fixes. Rather than treating a performance dip and a quality complaint as two separate issues to be routed to two separate teams, a shared data set often reveals they are the same problem viewed from two different angles, which means one fix can resolve both at once instead of two teams working in parallel on what looks like unrelated symptoms.
Building a Culture Around the Data, Not Just the Dashboard
A dashboard only drives operational excellence if people trust what it shows and act on it consistently. That trust tends to come from giving industrial engineers and team leads a shared, structured view of the line, rather than each person working from their own version of what happened during a shift. When everyone is looking at the same data, disagreements over what really happened during a slowdown tend to disappear, replaced by a shared starting point for solving the actual problem.
This also reframes what IE and supervisor roles look like day to day. Less time goes into manually collecting data with a stopwatch or clipboard, and more goes into analyzing what the data is already showing and deciding what to fix next. Over time, this tends to shift the tone of shift handoffs and daily production meetings as well, since conversations start from a shared, accurate picture of the previous shift rather than a verbal summary that can vary depending on who is telling it.
What This Looks Like in a Real Production Environment
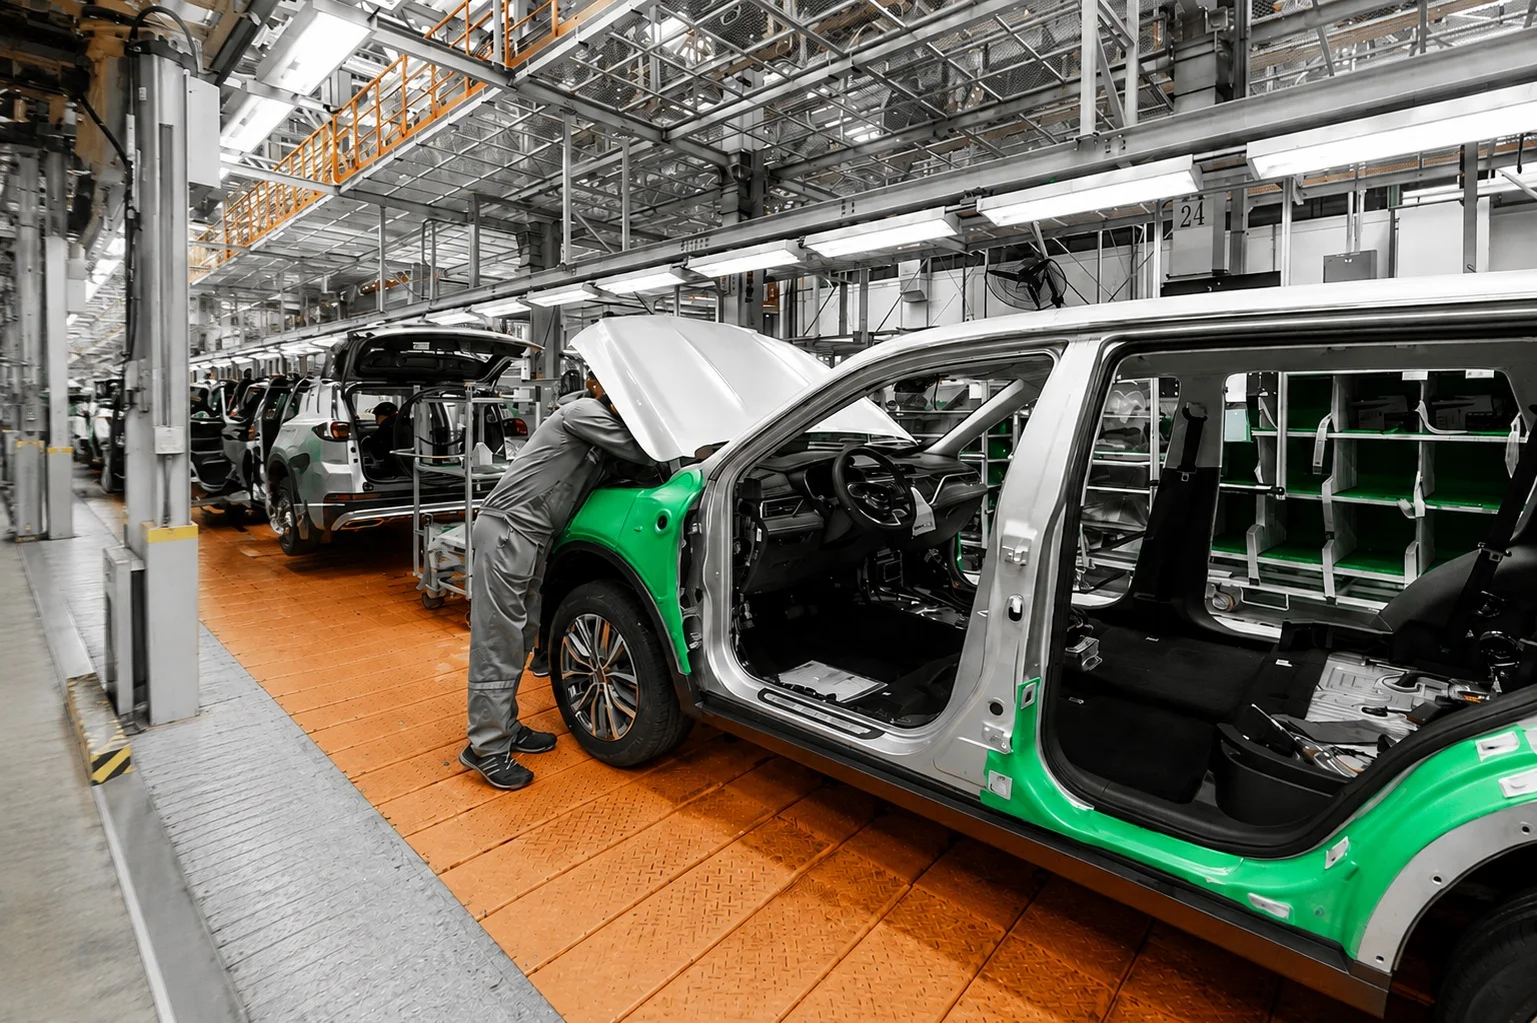
In automotive assembly, where line balance and takt time are tightly managed, and even small deviations ripple across the whole line, this kind of visibility is not optional. It is part of how OEMs and suppliers stay synchronized across dozens of stations running in sequence. Our Automotive page covers how manufacturers in this space use continuous performance data to keep every station in step with the line’s takt time, catching drift before it compounds into a missed shipment.
The same logic applies across other highly regulated, tightly sequenced environments, including aerospace manufacturing, where tolerances are tighter, and the cost of an undetected process drift is measured in far more than a missed shipment. In either case, the underlying need is the same: continuous, trustworthy data that everyone on the floor and in the office is working from.
Conclusion
Operational excellence is not something a plant achieves once and maintains automatically. It is sustained through ongoing visibility into what is actually happening on the floor, shift after shift, and the discipline to act on that data consistently rather than periodically. The plants that sustain it longest are rarely the ones with the most ambitious improvement projects. They are the ones that never stopped watching closely enough to notice when something started to slip.
Our vision execution system from Invisible AI gives every line and shift that kind of continuous visibility, turning production data into the decisions that keep a plant moving toward operational excellence instead of just measuring how far it still has to go. If you would like to see what that looks like on your own floor, book a demo with our team.