
A line can hit its throughput target every single day and still be leaking money. Machines run and parts ship, but somewhere between planned production time and what actually makes it out the door, hours disappear into micro-stops, slow cycles, and rework nobody logged. Overall Equipment Effectiveness, or OEE, is the metric built to catch exactly that gap. It combines availability, performance, and quality into one score that shows how much of a plant’s planned production time actually turns into good parts, made at the right speed, without interruption.
For decades, tracking OEE meant clipboards, stopwatches, and periodic time studies that captured a snapshot rather than the full picture. OEE monitoring software changes that by measuring continuously, station by station and shift by shift. This article looks at what OEE monitoring software actually does, why real-time data changes how teams respond to inefficiency, the losses it tends to surface first, and what to look for when evaluating a system for your own floor.
What OEE Monitoring Software Actually Does
Traditional OEE tracking relied on someone walking the floor, sampling a handful of cycles, and extrapolating from there. It beat nothing, but it left long stretches of the day unmeasured and depended entirely on whoever happened to be watching. OEE monitoring software replaces that sampling with continuous data capture. Instead of estimating availability from a shift report, it records every stop, every changeover, and every cycle as it happens.
The software calculates each component of OEE from that raw data. Availability comes from tracking planned versus actual run time, including every unplanned stop. Performance compares actual cycle time against ideal cycle time, cycle by cycle. Quality tracks the ratio of good parts to total parts produced, including scrap and rework. Instead of a single end-of-shift number, teams get a live score that updates continuously and a dashboard that shows exactly where time and quality are being lost.
This matters most in the moments between the obvious wins and the obvious problems. A total line stoppage gets noticed immediately, no matter how a plant tracks data. What manual tracking misses is the slow leak: a station that is running five percent slower than standard, day after day, without ever triggering an alarm or showing up as a clear incident. That kind of loss is invisible on a paper log and easy to write off as normal variation. It is exactly the kind of loss continuous OEE monitoring is designed to surface.
Why Real-Time OEE Data Changes the Efficiency Equation
The real value of OEE monitoring software isn’t the score itself. It’s what real-time visibility lets a team do differently. With manual tracking, a slowdown usually surfaces in a shift report the next morning, long after the cause is forgotten and the line has moved on. With continuous data, a team lead sees a station’s cycle time drifting while it’s happening and can walk over to find out why before it becomes a pattern.
This shift also changes how process improvements get validated. A single before-and-after time study can be misleading, since it only captures one set of conditions on one day. Continuous data lets a team see whether a fix actually held up across different operators, shifts, and product mixes, with a level of statistical confidence a small sample can’t provide. That distinction matters more than it sounds. Plenty of improvements look good for a week and quietly fade once the person who made the change stops watching. Continuous OEE data catches that regression immediately instead of months later, when it shows up as a mystery in the quarterly numbers.
Common Sources of Efficiency Loss OEE Software Surfaces
Once a plant moves from sampled to continuous tracking, certain losses tend to show up that manual methods rarely catch.
Micro-stops: Short pauses of a few seconds or a minute rarely make it onto a paper log, but they add up fast across a shift.
Cycle time variability: Two operators running the same station can have meaningfully different cycle times, and that gap often gets averaged away in manual sampling.
Changeover creep: Setup and changeover times tend to drift longer than the documented standard, a little at a time, until nobody remembers what normal actually looked like.
Quality-driven slowdowns: Rework loops and extra inspection steps quietly eat into performance and often get logged only as a quality issue, even though they affect OEE just as much.
Seeing these losses clearly is the first step. Understanding why they happen, station by station, is what actually moves the number. A dashboard that simply reports a lower OEE score does not tell a team what to fix. The value comes from being able to trace that score back to a specific loss category, at a specific station, during a specific window of time, so the next conversation on the floor is about a concrete cause rather than a general sense that things slowed down.
How Vision-Based Monitoring Adds Context to Manual Systems
Machine signals from a PLC can tell you a station stopped. They can’t tell you why an operator paused, reached for a part twice, or waited on an upstream process. That is where camera-based monitoring adds something traditional OEE systems miss.
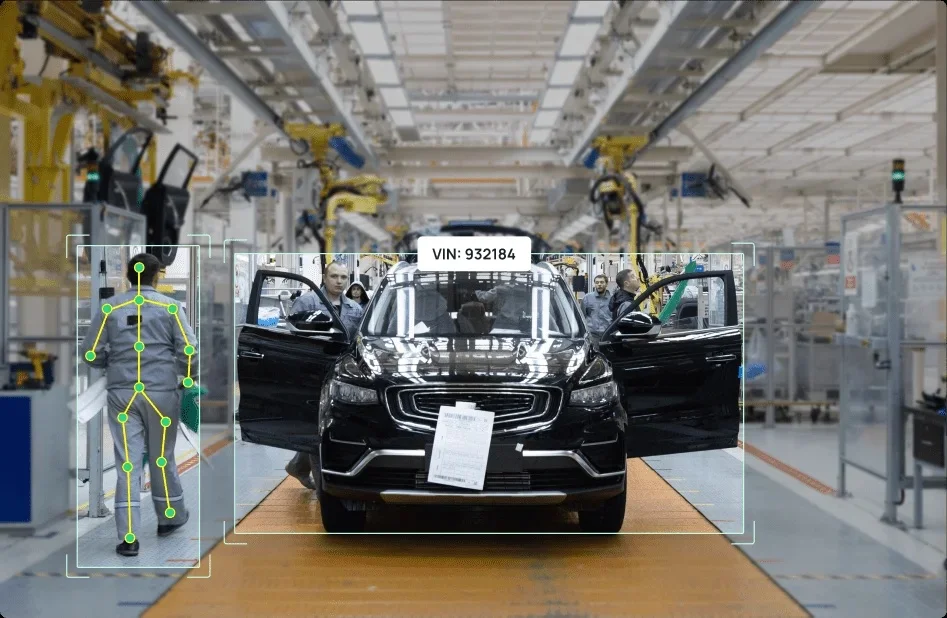
Our How It Works page explains how lightweight cameras capture human motion and object movement on the floor without wearables or added infrastructure, converting what used to require a clipboard and a stopwatch into structured, cycle-level data automatically. For OEE specifically, this means a performance loss is not just a number on a dashboard. It comes with video context showing exactly what happened at that station during that cycle, so an industrial engineer can see the actual cause instead of guessing from a data point alone.
What to Look for in an OEE Monitoring Solution
Not every OEE tool is built the same way, and the differences matter once you are running it across multiple lines and shifts. A few things worth evaluating before you commit to one:
Deployment effort: Some systems require significant IT integration before they produce useful data, while others can be installed and calibrated quickly with minimal disruption to production.
Real-time alerting: A system that only compiles a report at the end of the day still leaves a team reacting to a shift late. Look for alerts that reach a team lead the moment a station starts drifting.
Drill-down capability: A single plant-level OEE number is a starting point, not an answer. The system should let a team move from that number down to a specific line, station, and cycle.
Data handling: Manufacturers working with sensitive processes or OEM customer data often need deployment options that keep information on-site rather than routed through the cloud.
Our Production Management solution is built around this kind of real-time visibility, giving team leads a live pulse on every line with alerts the moment cycle times drift or throughput drops, so issues get addressed the moment they appear rather than at the next shift meeting.
It is also worth asking how a system scales. A pilot on one line often looks impressive regardless of the underlying technology. The harder question is what happens when a plant tries to roll the same system out across ten lines and three shifts. Systems that depend heavily on manual configuration per station tend to become a maintenance burden at scale, while systems designed for rapid, guided deployment tend to hold up far better as coverage expands.
The Business Case: What Improved OEE Delivers
OEE gains translate directly into numbers leadership already tracks. According to Fluke’s 2025 industrial manufacturing survey, more than six in ten manufacturers experienced unplanned downtime in the past year, with incidents averaging $1.7 million per hour once they occurred (source: Fluke, Unplanned Downtime Costs Manufacturers Up to $852M Weekly). Even a modest reduction in downtime or performance loss, caught earlier because of continuous monitoring, adds up quickly at that scale.
World-class OEE sits around 85 percent, though most manufacturing plants operate closer to 60 percent, based on the benchmark widely used across the industry (source: OEE.com). That gap between average and world-class rarely closes because a team works harder. It closes because a team can finally see losses clearly enough to act on them consistently, which is exactly what continuous OEE monitoring is built to do.
Customers using our platform have reported similar results in their own facilities. You can read more in our Case Studies, where plant and quality teams describe root-cause issues in minutes instead of hours and react to slowdowns before they affect a full shift.
The gains tend to compound, too. A five-point improvement in OEE rarely comes from one big fix. It usually comes from a series of smaller corrections, a changeover trimmed here, a micro-stop eliminated there, each one visible only because the underlying data was continuous enough to catch it. Over a year, that steady accumulation of small wins is often worth more than any single large initiative, and it is only possible when a team can see the losses clearly enough to chase them one at a time.
Conclusion
OEE has always been the right metric for measuring true manufacturing efficiency. What has changed is how it gets measured. Moving from periodic sampling to continuous, cycle-level data turns OEE from a lagging report card into a live operating signal, one a team can act on the same shift instead of the next morning.
We built Invisible AI’s vision execution system to capture that data continuously, across every line and shift, without requiring wearables or disrupting the operator’s task. If you are ready to see what continuous OEE visibility looks like on your own floor, book a demo with our team.